

v0.1.0 in preparation open source · Apache-2.0
Room for every row.
An open-source spreadsheet for data that doesn’t fit in a spreadsheet. Hundreds of millions of rows, real Excel formulas, SQL when you want it — on your laptop or your own server. Your data never leaves it.

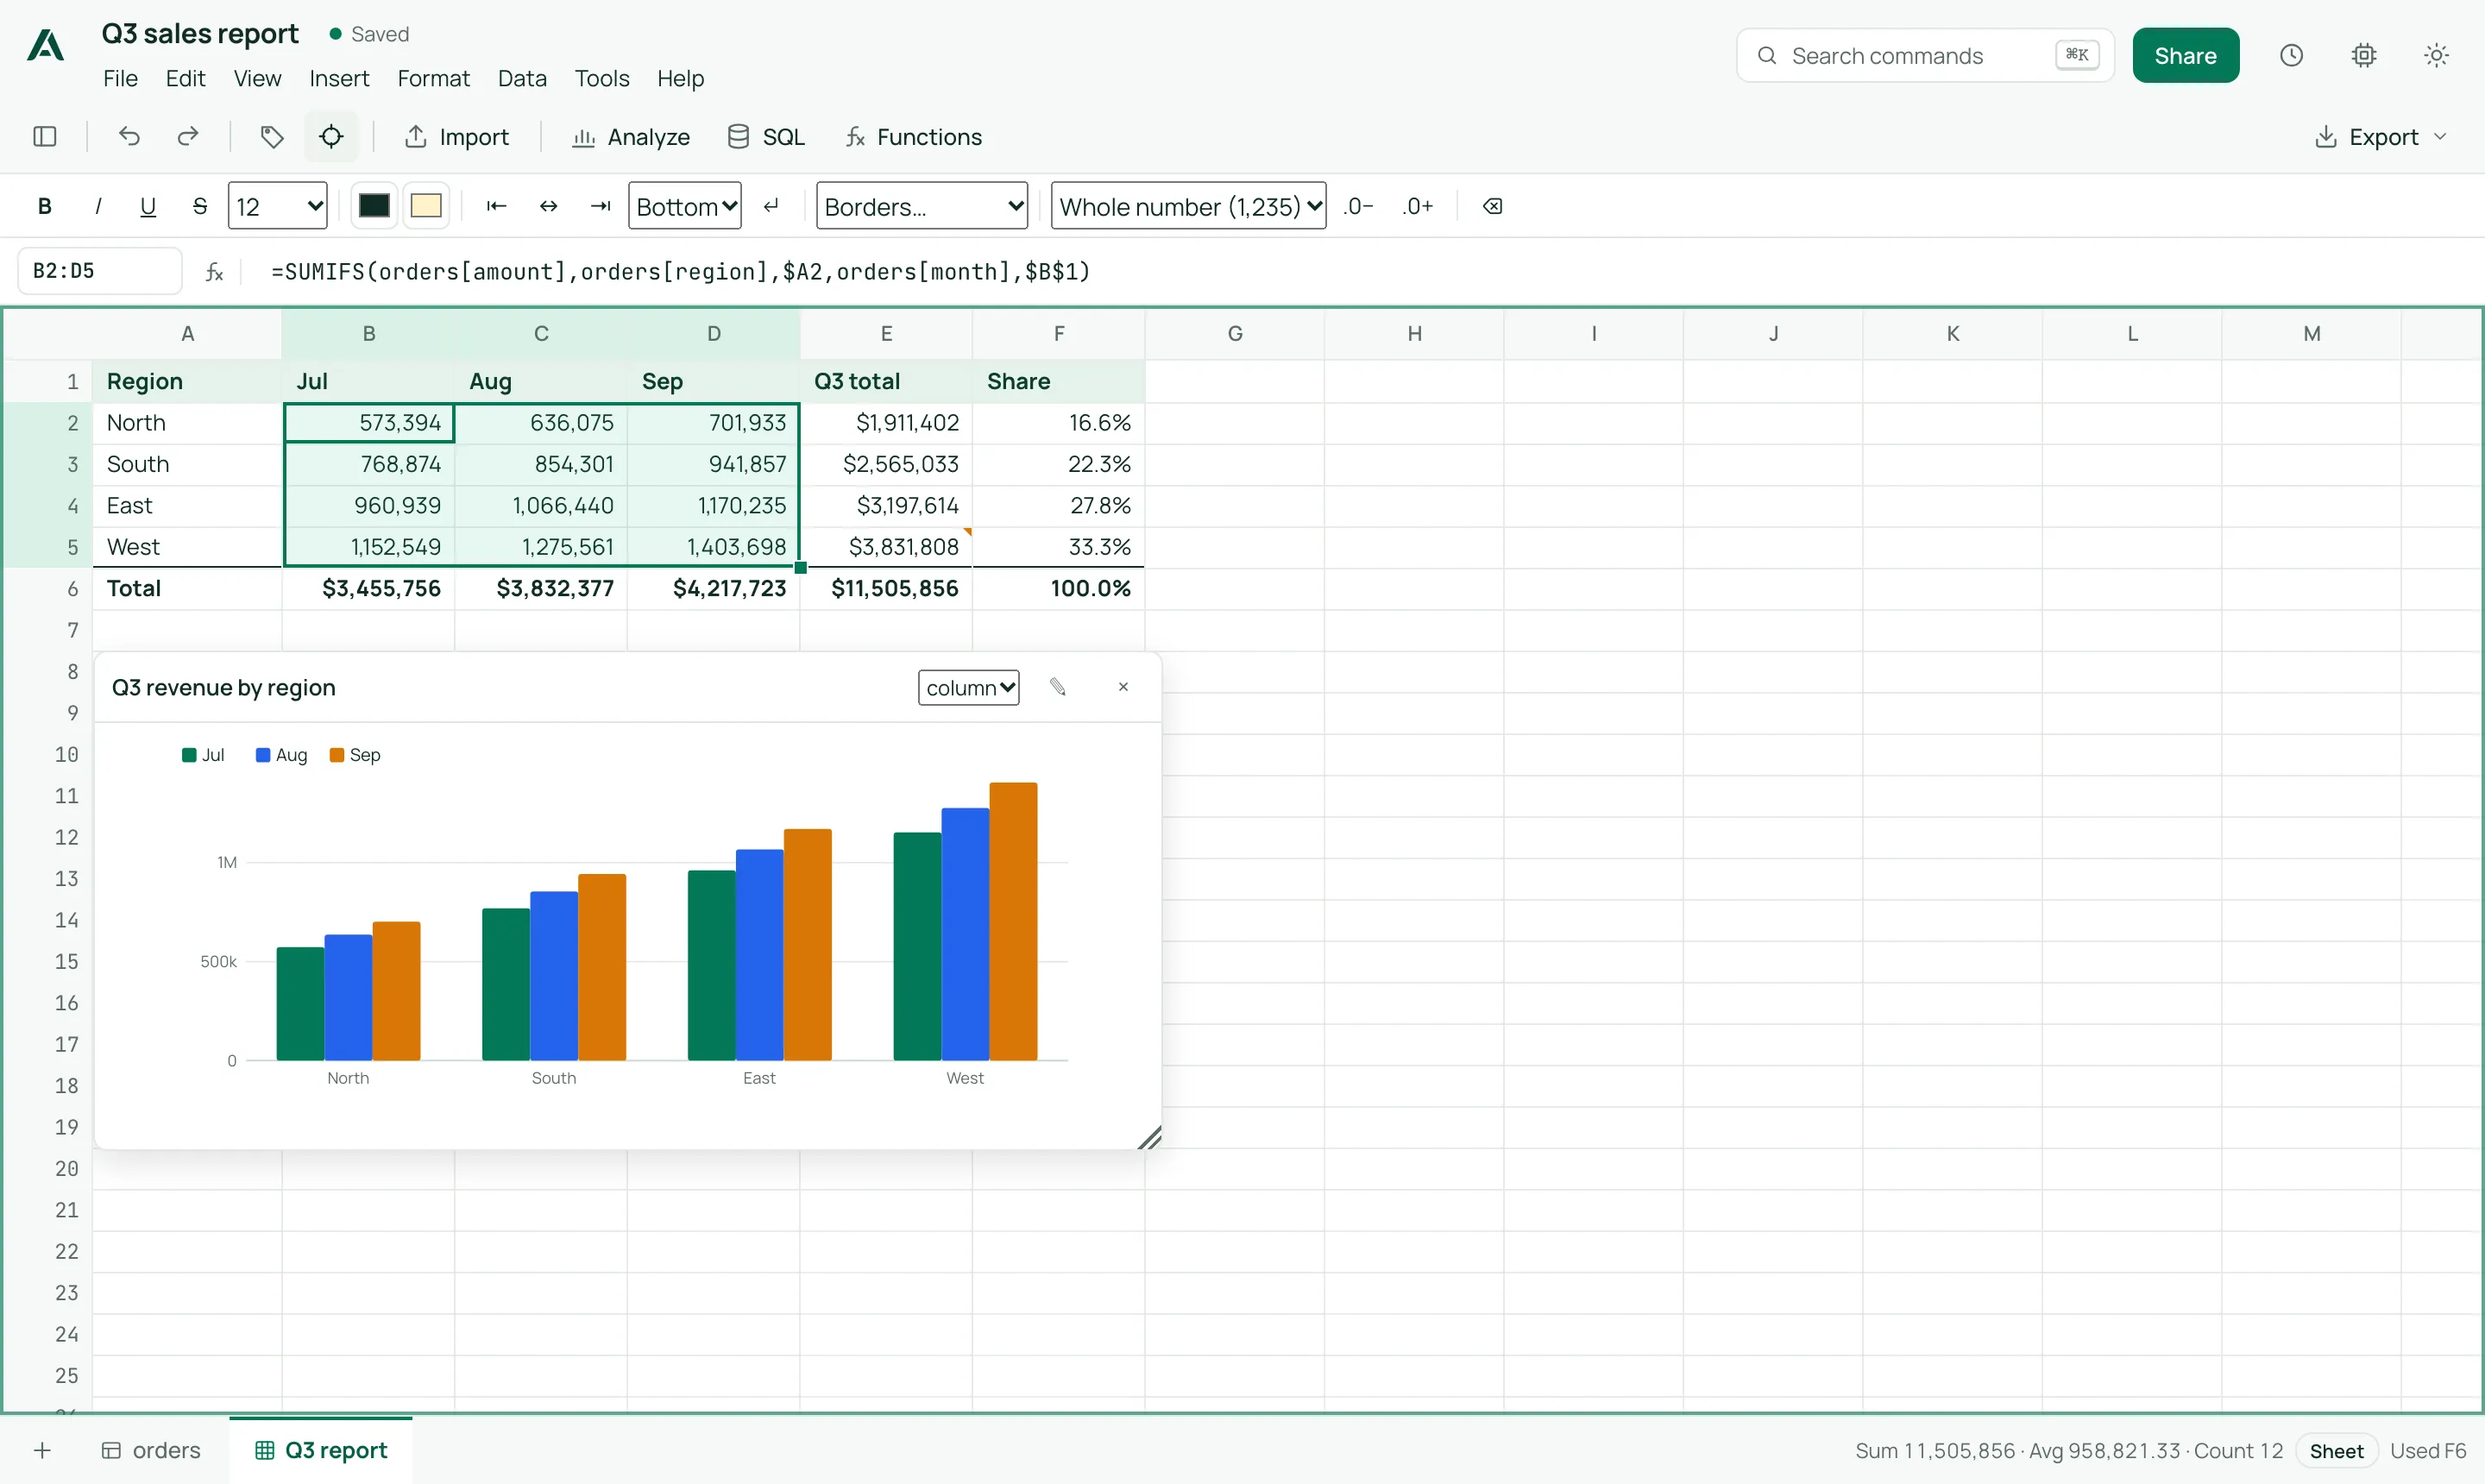
A sheet pointing SUMIFS at a 20,000-row table — formatting, a chart and the fill handle included.
A real spreadsheet, next to real data
Sheets use Excel syntax on an Excel-compatible engine, so
XLOOKUP, SUMIFS, dynamic arrays, LET and
LAMBDA behave the way you expect — and a sheet formula can read a whole
table as one query: =SUMIFS(orders[amount], orders[region], A2).
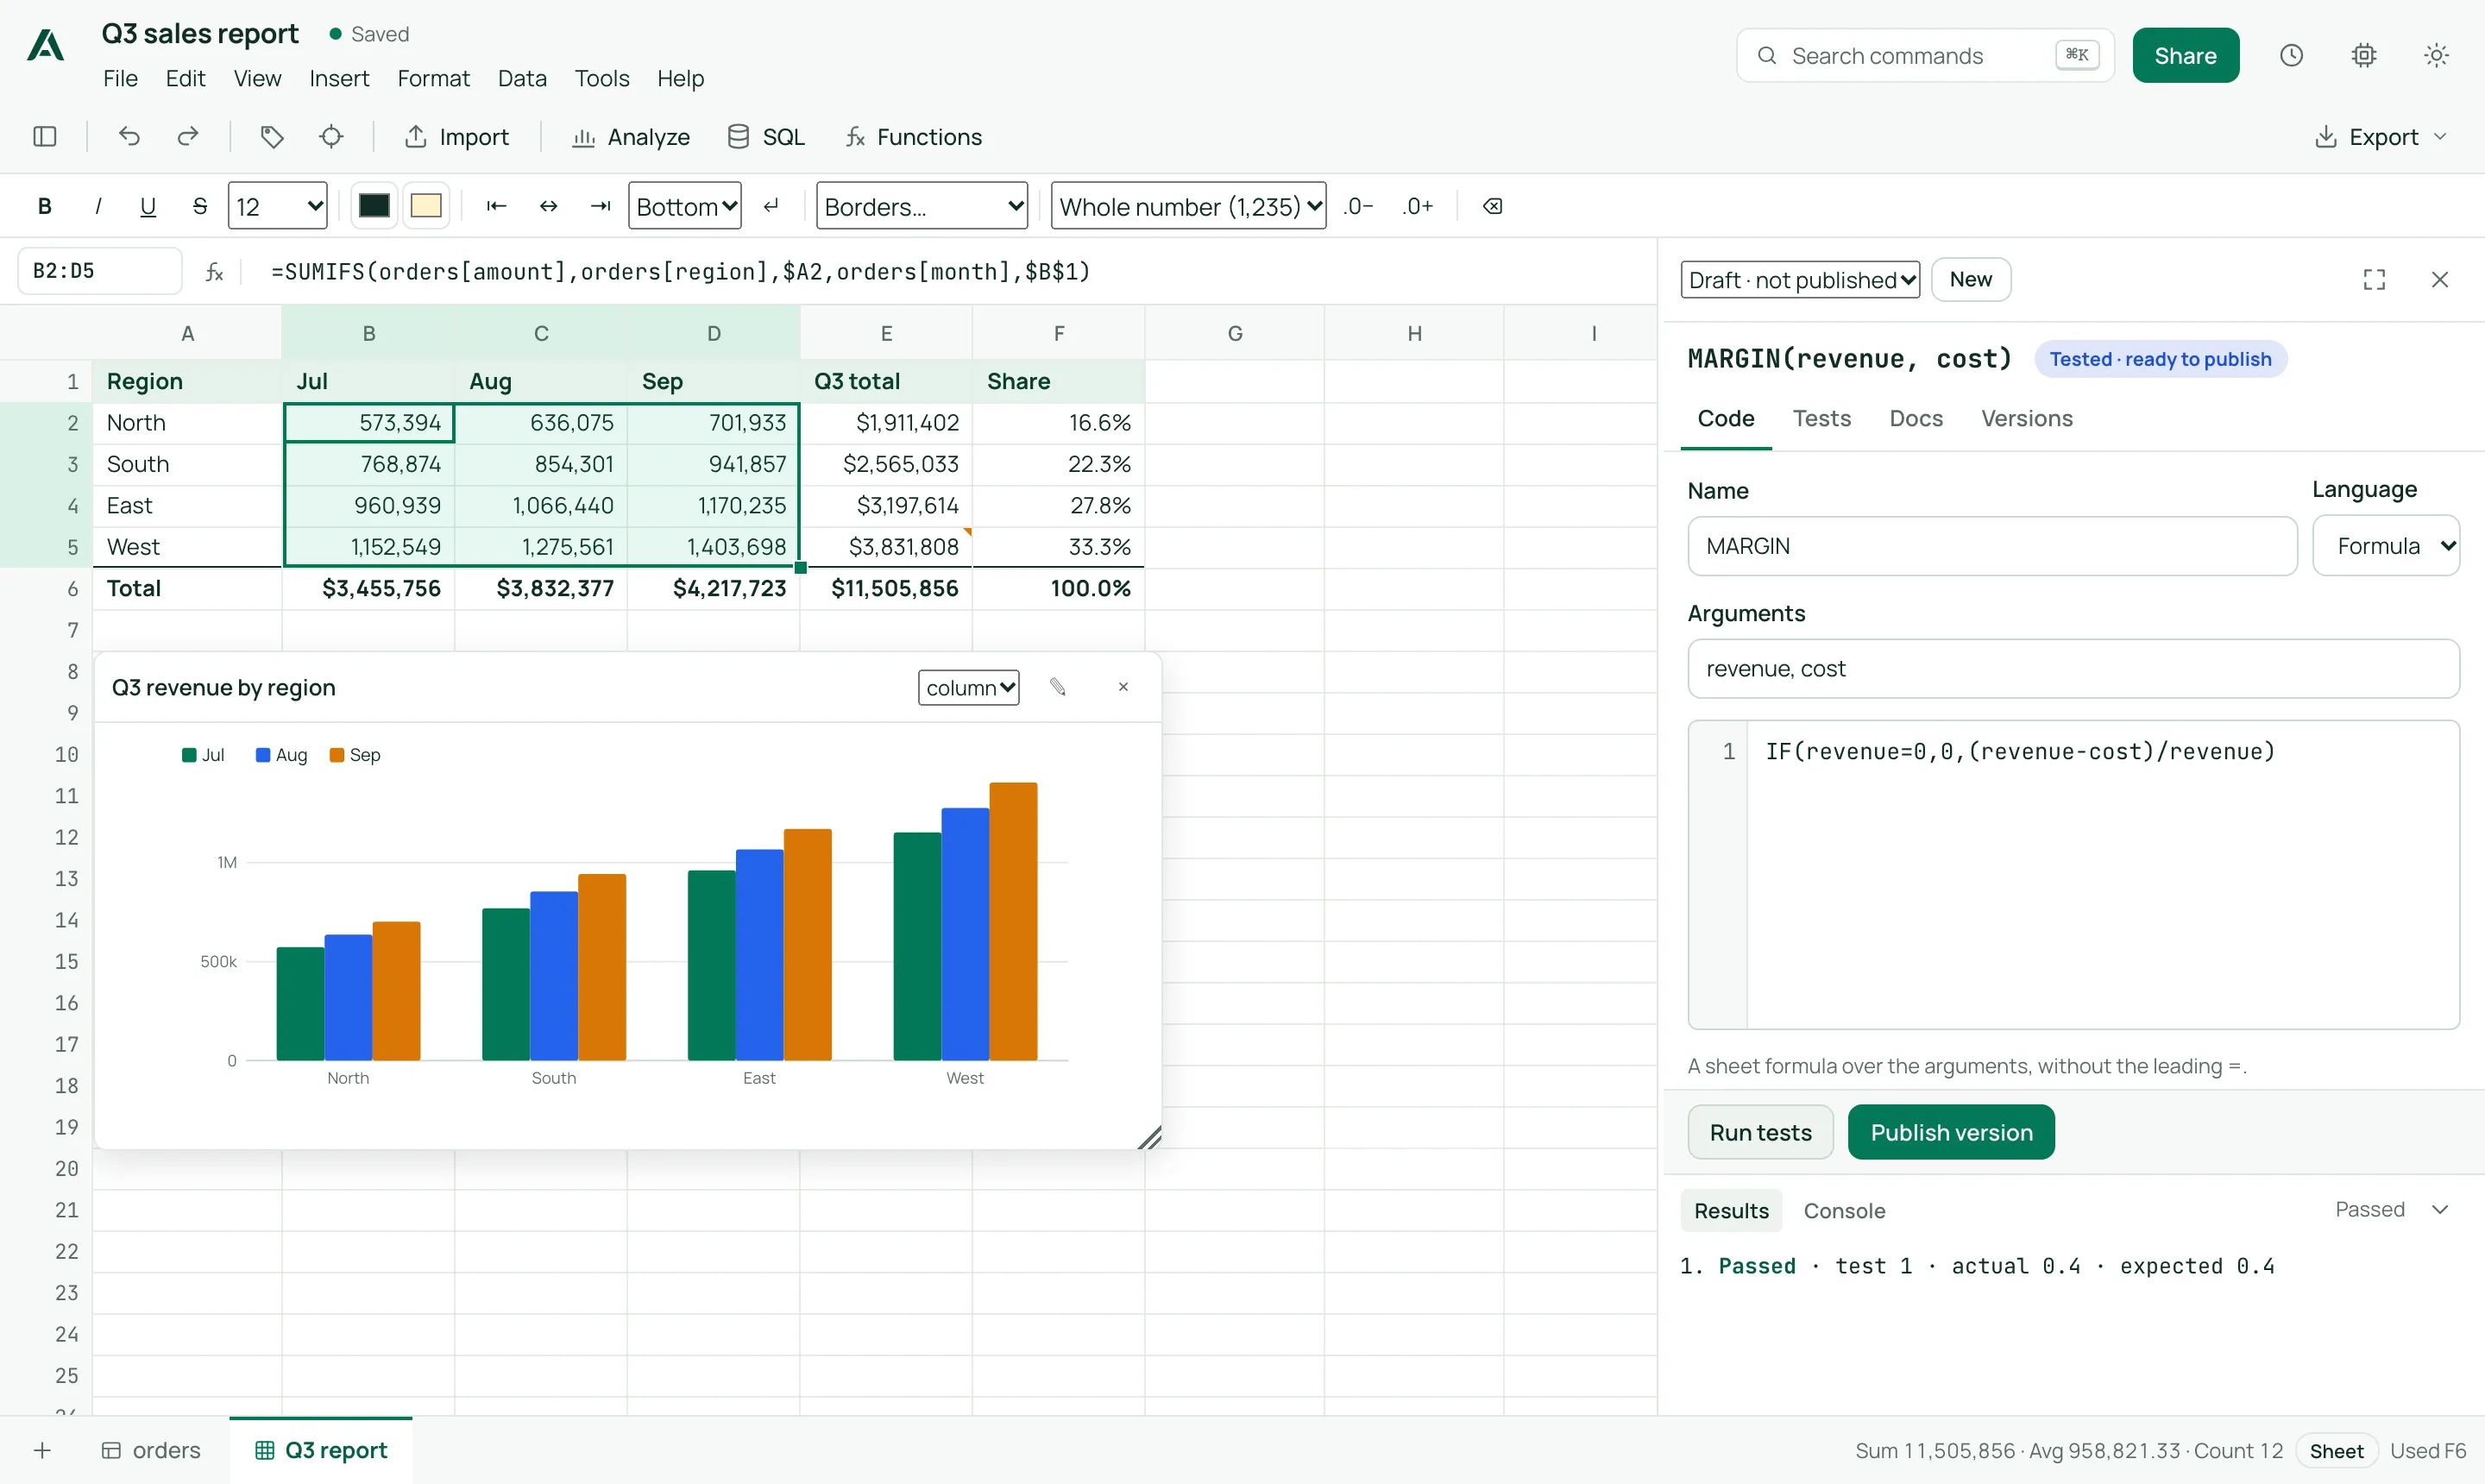
Your own functions
Sheet formulas, SQL expressions or sandboxed Python — with tests, published versions, pinning and rollback.
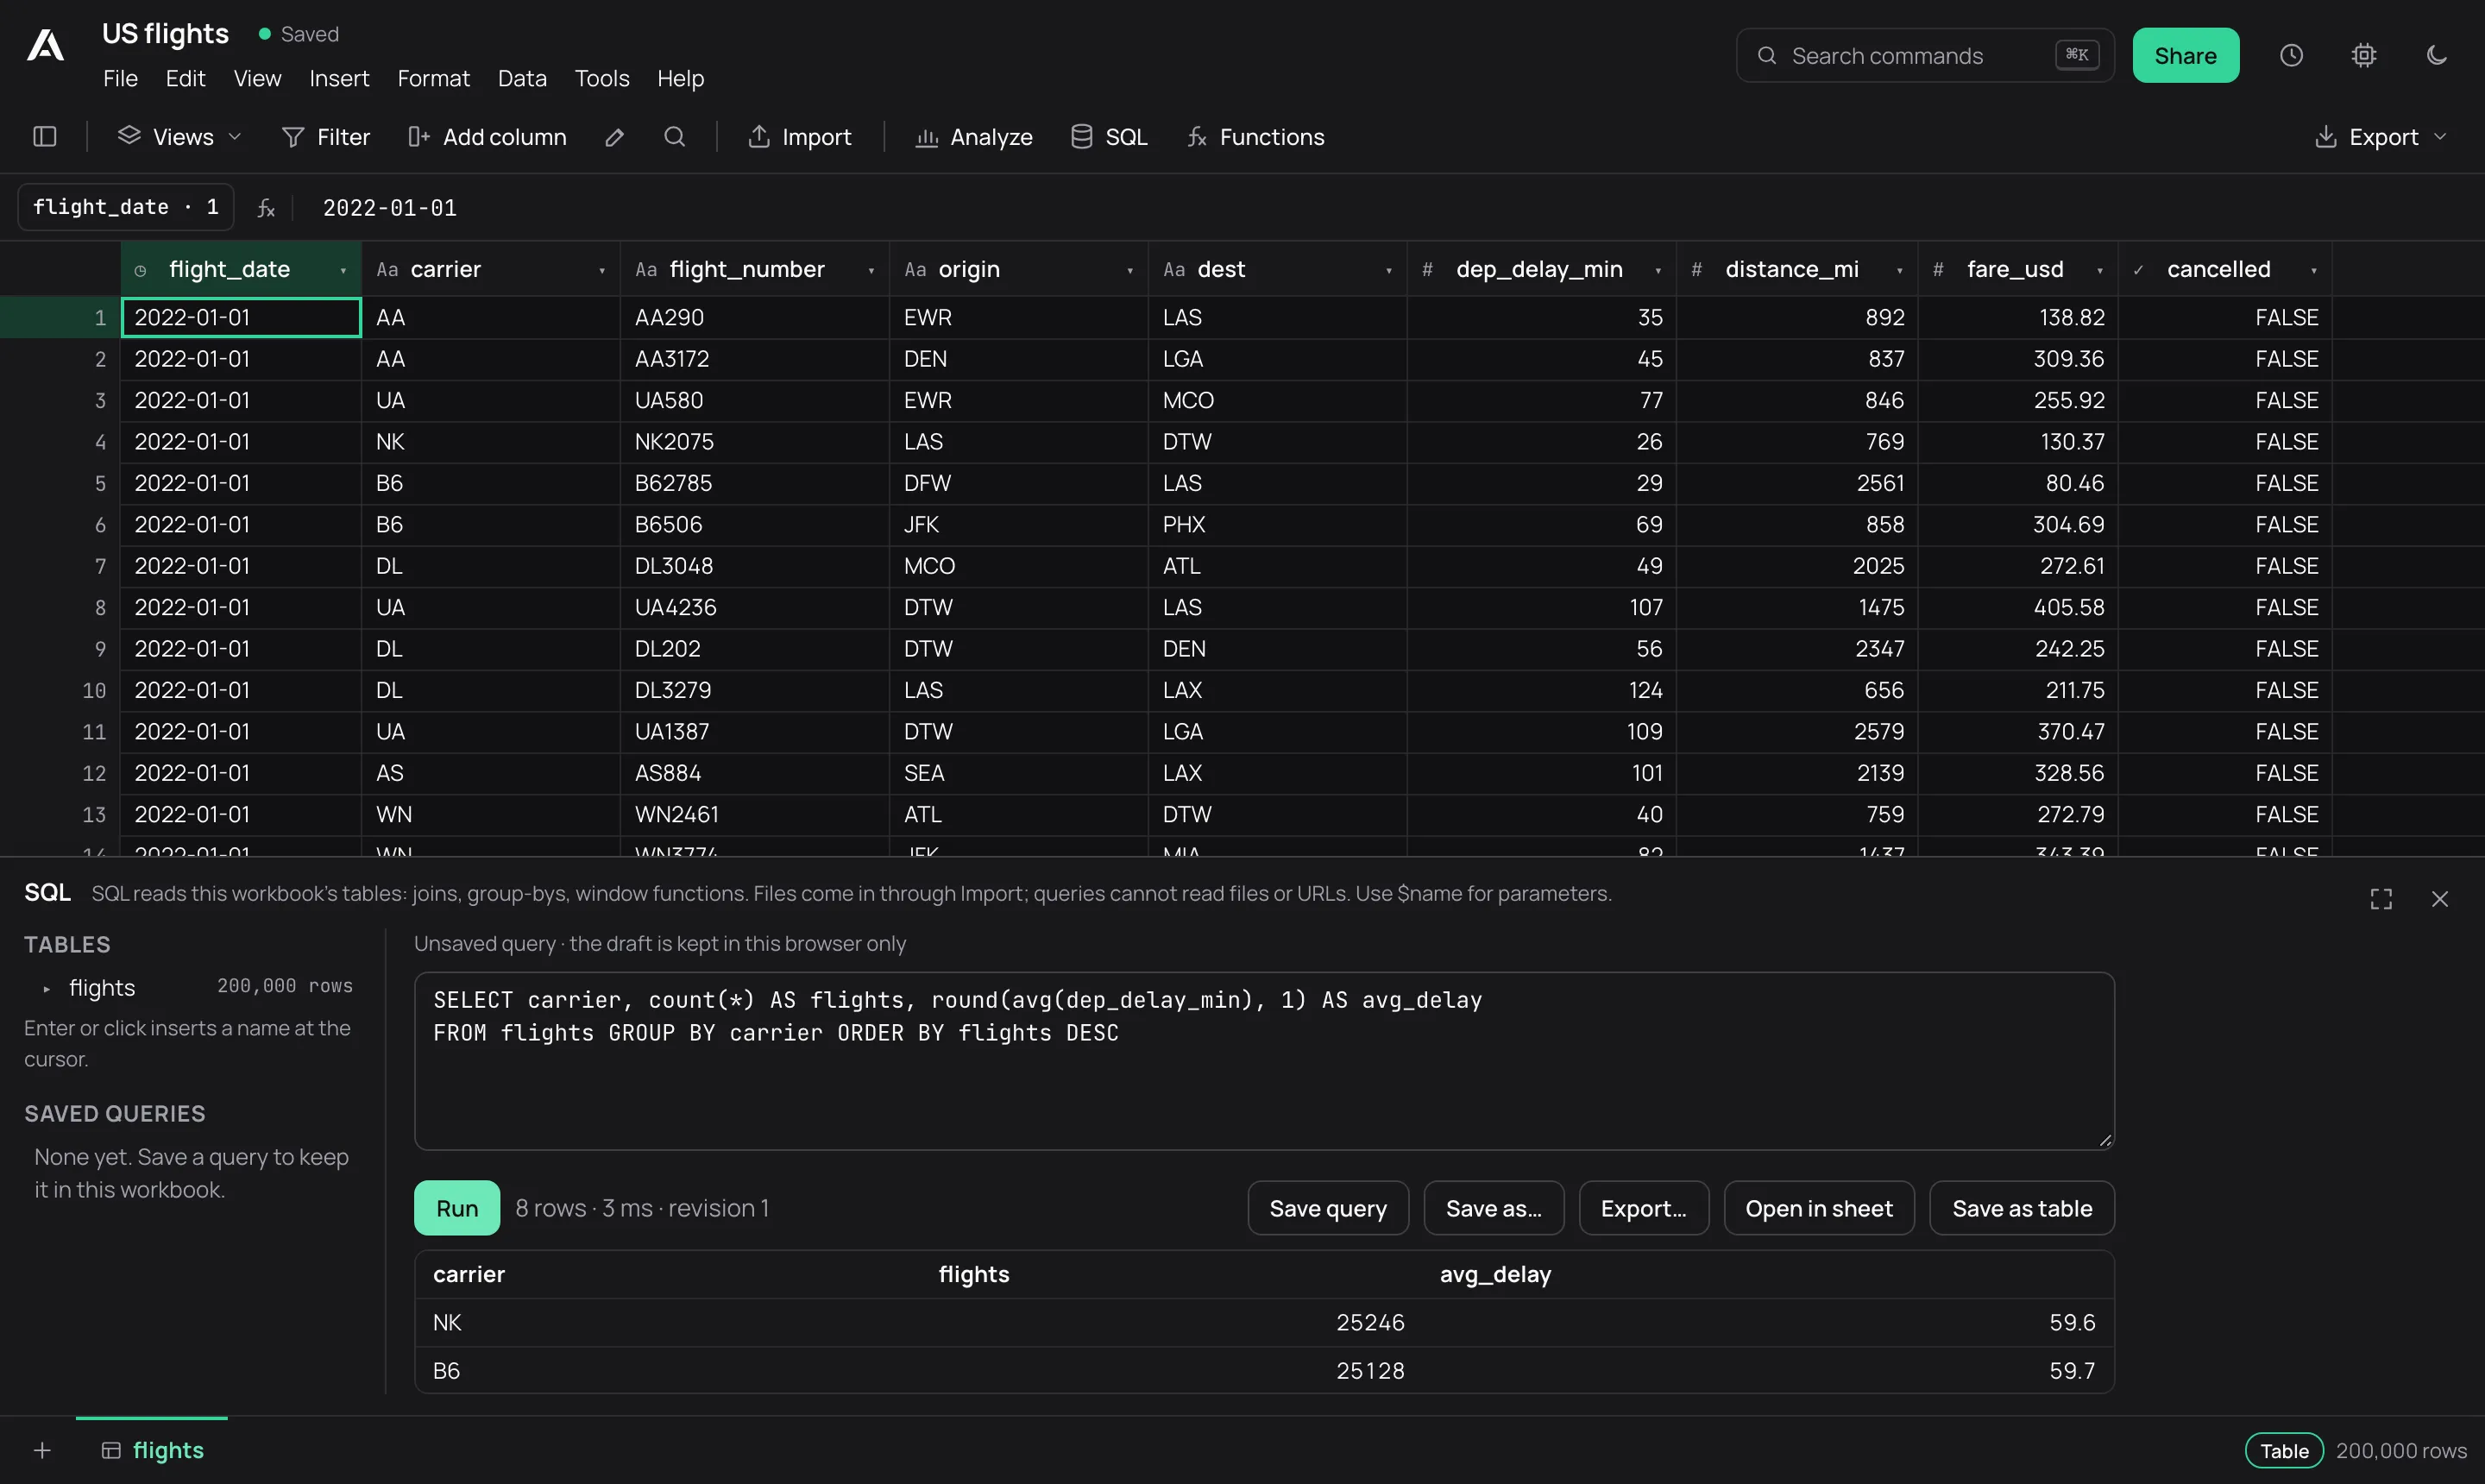
SQL when you want it
Schema browser, autocomplete, cancellable previews — docked under the grid, closed until you open it, and a server can turn it off.
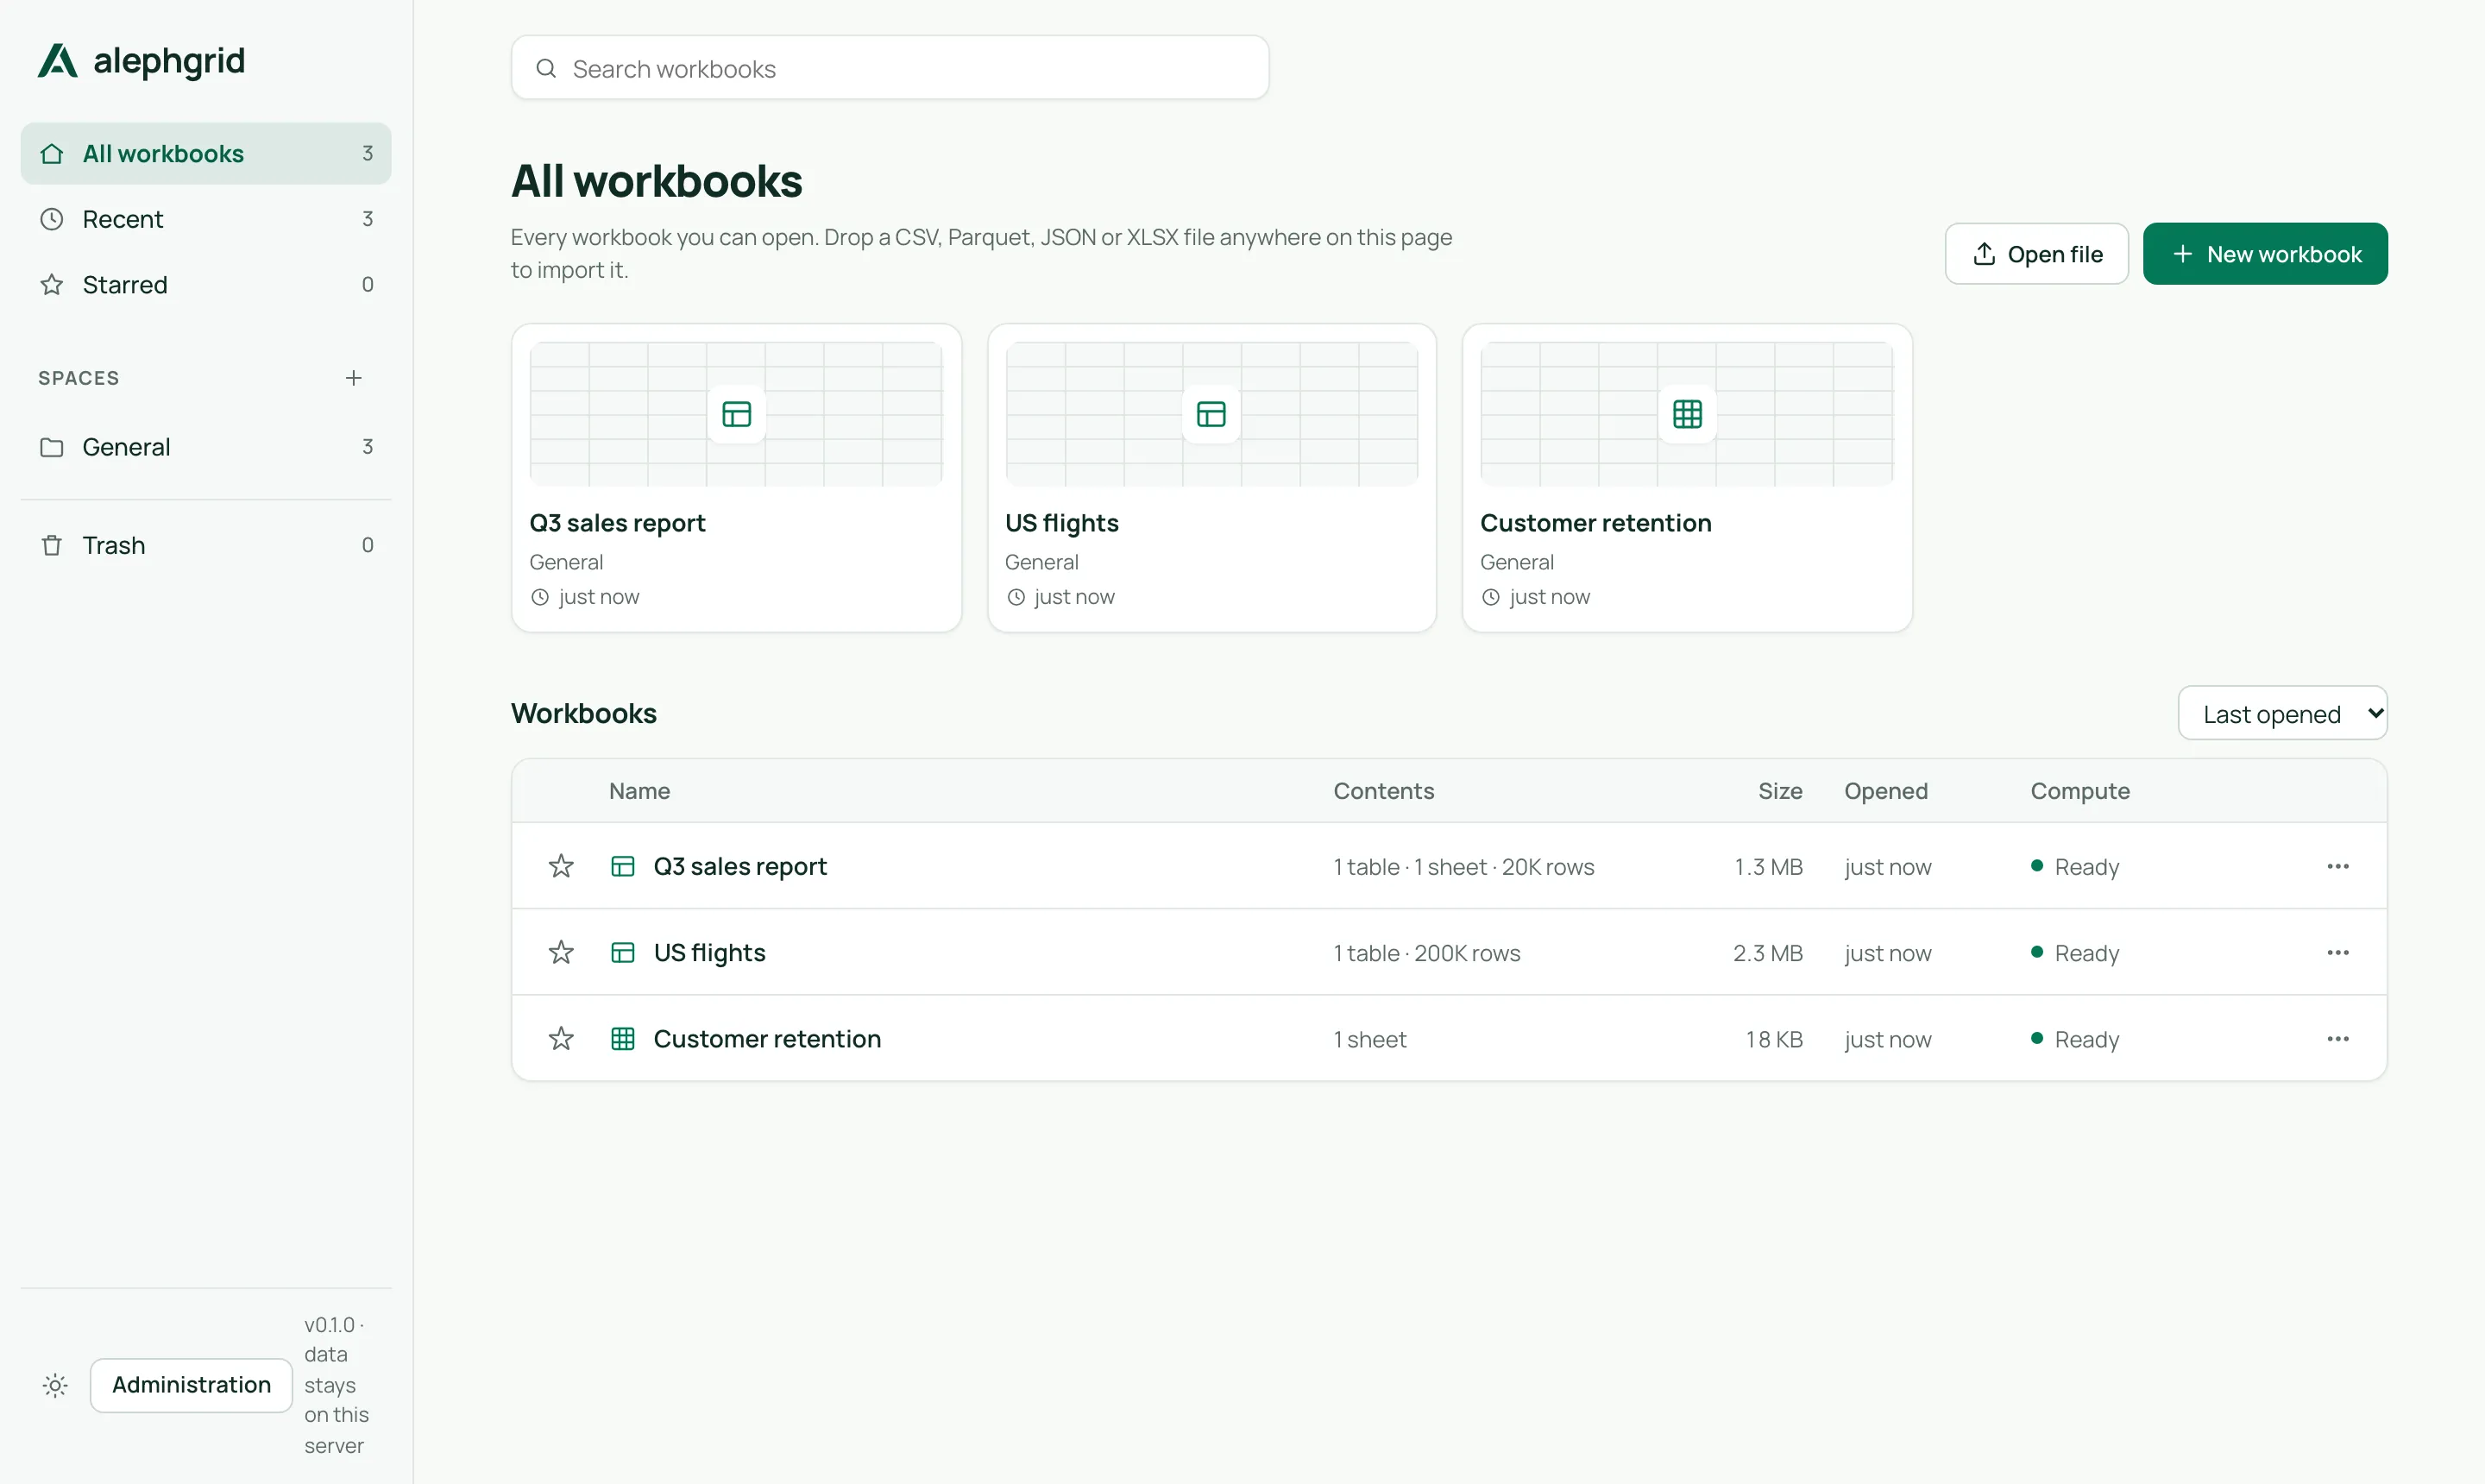
The hub
Every workbook, its size and whether its compute is running — with live collaboration and revision restore inside each one.
Big tables stay fast
Opening a workbook reads nothing into memory. The grid asks only for the rows on screen, sorts build a permutation instead of a copy, and calculated columns compute only what you look at. Everything runs on a DuckDB file on your machine.
- Import anything tabular
- CSV/TSV, Parquet, JSON/JSONL and gzip as tables; XLSX as editable sheets. Drag and drop or CLI — streamed, with types and samples reviewed before commit.
- Scroll to row 900,000,000
- A range read, not a load. Typed edits, calculated columns (
=[fare_usd] / [distance_mi]), multi-column sort, filters with value counts, saved views. - Analyze without SQL
- Summaries, pivots, joins, charts and column profiles from the Analyze pane; live sum, average and count of any selection.
- Export on your terms
- CSV, Parquet or JSON lines for any table or filtered view; XLSX for sheets, with a report of anything XLSX cannot hold.
Quick install
Alephgrid is pre-release: today you build it from source. Native binaries, package managers and published container images arrive with v0.1.0 — the releases page tracks exactly what is ready.
git clone https://github.com/alephgrid/alephgrid && cd alephgrid
(cd web && npm install && npm run build)   # build the UI, embedded into the binary
cargo build --release
./target/release/alephgrid --demo-rows 10000000 Requires Rust 1.88+ and Node 20+. The first build compiles DuckDB and takes several minutes. Full guide: getting started.
Run it where your data lives
On your computer
One binary with the UI embedded, data in a plain directory, listening on 127.0.0.1 with no sign-in needed. The easiest way to start.
On your server
The same binary with accounts: spaces, owner/editor/viewer roles, password or OpenID Connect sign-in, quotas, audit log and backups.
Packaged deployments
Published container images and a Helm chart are planned after the first release. Until then, self-hosting builds from source.
Open development
Apache-2.0, developed in the open. There are no seats, tiers or paywalls: export, sign-in, teams and every other feature are free.